Why does AI give different answers to the same prompt? We sent the same prompts to three models over five months. After two weeks, GPT-5 nano repeated an average of 53% of the brands from its previous answer, Gemini 3.1 Flash-Lite repeated 49%, and Claude Haiku 4.5 20.2%; in 41% of Claude pairs, no brand appeared in both answers. Yet a category top 10 built from 50 prompts retained about 8 of 10 brands for GPT and Gemini, and 6.7 of 10 for Claude. A single screenshot therefore cannot tell you whether a brand is part of a niche's recommendation landscape. We analyzed 65,544 successful responses from API models without web search, not from the consumer ChatGPT, Gemini, or Claude apps.
How we measured
We tracked an unchanged set of prompts across 49 categories in the Ukrainian market. Each prompt was sent as a separate call to each model. This let us compare what changed in the answer to the same prompt between neighboring waves and what remained visible in an aggregate of 50 prompts about a category.
| Parameter | Study design |
|---|---|
| Categories | 49 public topics |
| Prompts | 50 Ukrainian prompts per category, unchanged across waves |
| Models | GPT-5 nano, Gemini 3.1 Flash-Lite, Claude Haiku 4.5 |
| Period | 11 waves from May 17 to October 6, 2026, about 14 days apart |
| Main analysis window | Waves 3 to 11, June 14 to October 6 |
| Successful responses | 65,544: 21,449 GPT, 22,050 Gemini, 22,045 Claude |
| Model instruction | Name 7 to 12 companies; provide links only when confident |
| Web search | Off for all calls |
| Brand extraction | A separate model extracted names; an alias dictionary merged known spelling variants |
| Jaccard similarity | Brands in both answers divided by brands in either answer, from zero to one |
| Top 10 retention | Number of brands in one wave's top 10 that also appeared in the next wave's top 10 |
Our core question was not whether a model repeated a whole paragraph word for word. We asked whether it mentioned the same companies, whether any appeared in both lists, and whether one model produced a more consistent category picture than another.
The same prompt two weeks later: how consistent are AI brand recommendations?
To test how consistent AI brand recommendations are, we compared adjacent waves for the same prompt and category. The table shows averages across the panel. Jaccard similarity describes list overlap, while an identical list requires every brand to match.
| Measure between adjacent waves | GPT-5 nano | Gemini 3.1 Flash-Lite | Claude Haiku 4.5 |
|---|---|---|---|
| Average Jaccard similarity | 0.39 | 0.36 | 0.13 |
| No shared brand | 11.0% | 5.5% | 41.3% |
| Identical brand list | 1.6% | 1.4% | 0.2% |
| Previous answer's brands repeated | 53.0% | 49.0% | 20.2% |
| Same brand first in both answers | 46.3% | 60.0% | 25.8% |
An identical list appeared in fewer than 2 out of 100 adjacent comparisons for each model. That does not mean every answer was random. Individual brands often returned, especially in GPT and Gemini, but the composition of a particular answer changed. By prompt intent, Jaccard barely moved: 0.38 to 0.41 for GPT, 0.35 to 0.38 for Gemini, and 0.11 to 0.17 for Claude; comparison prompts were slightly more stable.
An independent SparkToro and Gumshoe study collected 2,961 volunteer responses to 12 prompts in ChatGPT, Claude, and Google AI. The authors reported that the chance of seeing the same brand list in two answers was below 1 in 100 for ChatGPT and Google AI, and the same list in the same order appeared fewer than 1 in 1,000 times. One coauthor works at Gumshoe, which has a commercial interest in AI visibility measurement. Their study of inconsistent AI brand recommendations also counts brand frequency across many answers rather than treating one list as permanent.
Our earlier smartphone recommendation study in Ukraine used 15 prompts, each run three times on one day with web search on. Its Jaccard score was 67.1%. That is a different model, prompt pool, search mode, and question set, so it should not be read as a direct contradiction of this panel.
One prompt, 11 answers: an online pet store example
Here is one study prompt, translated from Ukrainian: “I want to find top online pet stores in Ukraine with transparent prices and delivery: recommend the best companies and their websites.” We sent the original Ukrainian prompt once per wave to each of the three models.
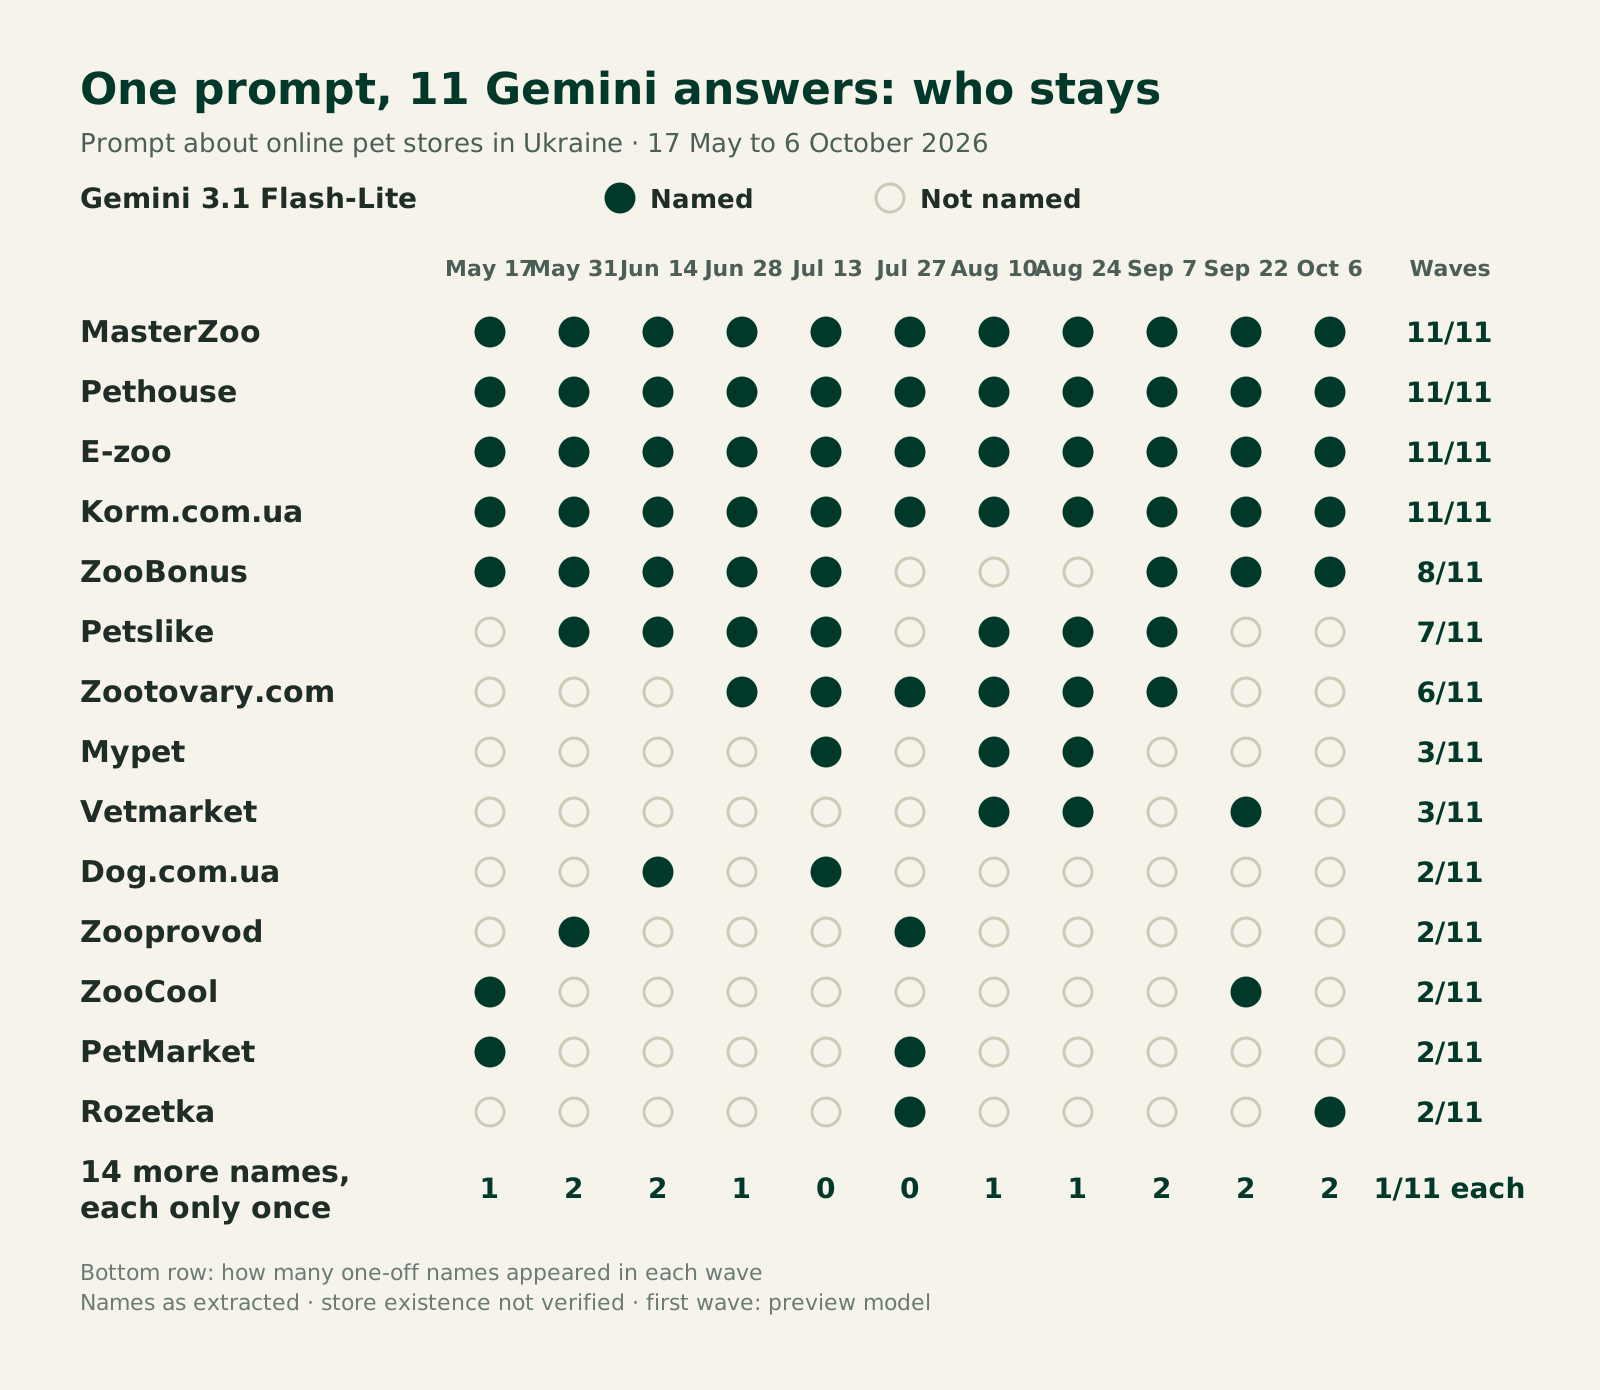
| Model | Average brands per answer | Distinct brands over 11 waves | In all 11 answers | Frequent examples | Named only once |
|---|---|---|---|---|---|
| Gemini 3.1 Flash-Lite | 8.6 | 28 | 4: MasterZoo, Pethouse, E-zoo, Korm.com.ua | 3 more in at least half the answers | 14 |
| GPT-5 nano | 4.9 | 23 | 0 | Rozetka 9 of 11; Prom.ua 7 of 11 | 14 |
| Claude Haiku 4.5 | 7.4 | 65 | 0 | Petmart 6 of 11 | 59 |
This table describes one prompt, not a ranking of all pet stores or a verification that every named company exists. Petslike shows what it means for a store owner: Gemini named it in 7 of 11 answers, but not in the last two, on September 22 and October 6. Someone who checked this prompt only in October would conclude that Gemini doesn't know the store. Someone who checked in August would see it on the list. Both screenshots are true, and neither shows how often the store appears.
How much is noise, and how much is real variation?
Some list differences come from extraction and naming rather than a model changing its recommendation. A model might use a legal company name in one answer and a product or shortened brand name in another. We used an alias dictionary, but it cannot resolve every ambiguous mention.
Across nine waves, the share of brand mentions that appeared in only one answer in that category was 31.2% for Claude, 7.9% for Gemini, and 6.3% for GPT. Brands appearing in fewer than 10 answers made up 54.2% for Claude, 25.1% for Gemini, and 18.7% for GPT.
In a manual review of 60 randomly selected Claude names that appeared only once, we found company-like names that were difficult to verify, examples outside the category, and truncated or oddly extracted names. This does not justify calling every rare mention fabricated. We examine how often AI invents websites for Ukrainian companies in a related study.
We recalculated similarity after filtering out less frequent brands. The thresholds do not prove that the remaining names are correct, and filtering mechanically increases overlap. Even among names that appeared in at least 50 category answers across nine waves, two lists for the same prompt shared only about half their brands.
| What we compared | GPT-5 nano | Gemini 3.1 Flash-Lite | Claude Haiku 4.5 |
|---|---|---|---|
| All extracted brands, Jaccard | 0.39 | 0.36 | 0.13 |
| Brands seen in at least 2 answers | 0.43 | 0.39 | 0.18 |
| Brands seen in at least 10 answers | 0.50 | 0.46 | 0.30 |
| Brands seen in at least 25 answers | 0.55 | 0.53 | 0.40 |
| Brands seen in at least 50 answers | 0.59 | 0.60 | 0.49 |
Filtering changes the question. It tells us whether the more frequent names overlap better, but not whether the full answer was stable. A brand appearing once may be meaningful in a narrow local category; frequency alone does not establish accuracy, quality, or recommendation strength.
What stayed stable at category level?
Here is the central result: the answers to an individual prompt were volatile, while the aggregate category top 10 was much steadier. We built a category list from 50 prompts and compared its composition between waves. Stable here means the composition of the top 10, not that every brand kept its exact rank.
From the May 31 top 10, 7.8 brands remained in the October 6 top 10 for GPT, 8.2 for Gemini, and 6.1 for Claude. This is close to the average retention between neighboring waves, 8.2, 8.3, and 6.7 respectively. If recommendations were drifting, the gap after five months would be much larger than after two weeks. It isn't, so the wave-to-wave churn is noise around a stable core. Here we compare one model with itself over time; how far different models agree with each other is the subject of a separate study on whether AI models recommend the same brands.
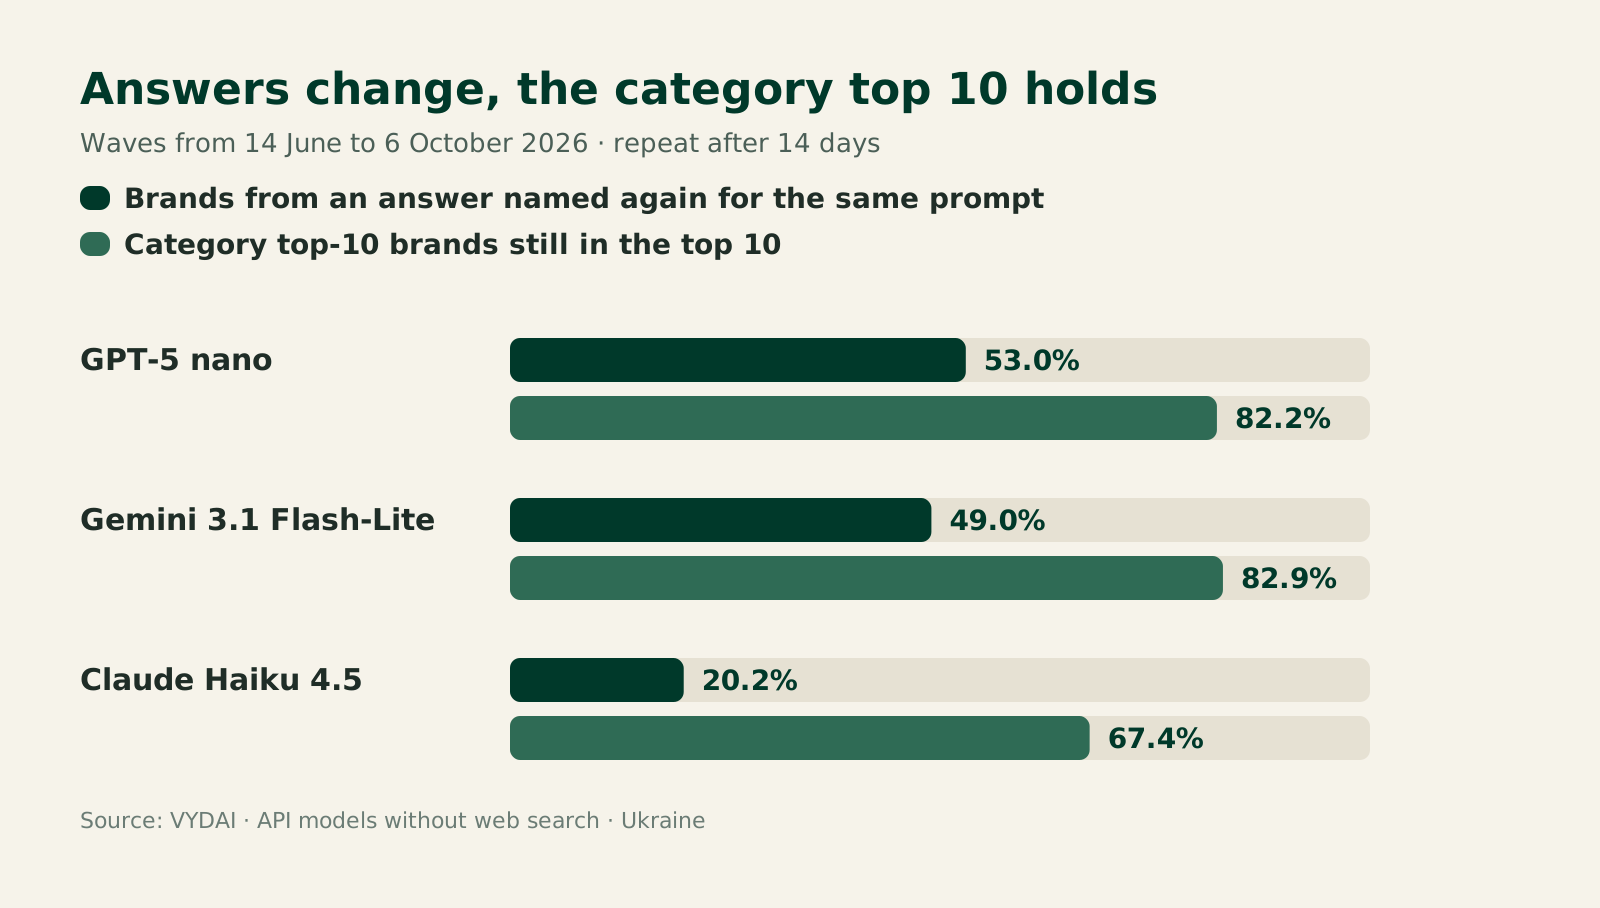
| Model | Top 10 kept in the next wave, average | Wave 2 top 10 still in wave 11 top 10 | Same first-place brand in the next wave |
|---|---|---|---|
| GPT-5 nano | 8.22 of 10 | 7.84 of 10 | 64.3% |
| Gemini 3.1 Flash-Lite | 8.29 of 10 | 8.18 of 10 | 78.1% |
| Claude Haiku 4.5 | 6.74 of 10 | 6.12 of 10 | 56.6% |
The same brand stayed first across all nine waves in only 13 of 49 GPT categories, 25 Gemini categories, and 10 Claude categories. A first-place change in one measurement is therefore weak evidence that the market or a brand's visibility has changed.
Which categories are more and less stable?
Variation depended on the category as well as the model. Average top 10 retention between waves was 9.6 brands in home goods, 9.3 in IT outsourcing, and 9.3 in electronics. It was 4.3 in beauty salons and spas, 4.6 in landscaping, and 4.7 in veterinary clinics.
In banks, the leading brand appeared in 46 to 47 of 50 answers, while the tenth-ranked brand appeared in 13 to 18. In beauty salons, the leader appeared in 4 to 13 answers and the tenth brand in 2 to 6. For GPT veterinary clinics, the leader appeared about 4 times among about 39 successful calls and the tenth brand about once. In these fragmented categories, one or two mentions can decide positions six through ten. Our interpretation is that local services produce less stable lists because location, specialty, and availability can change which businesses fit a broad prompt.
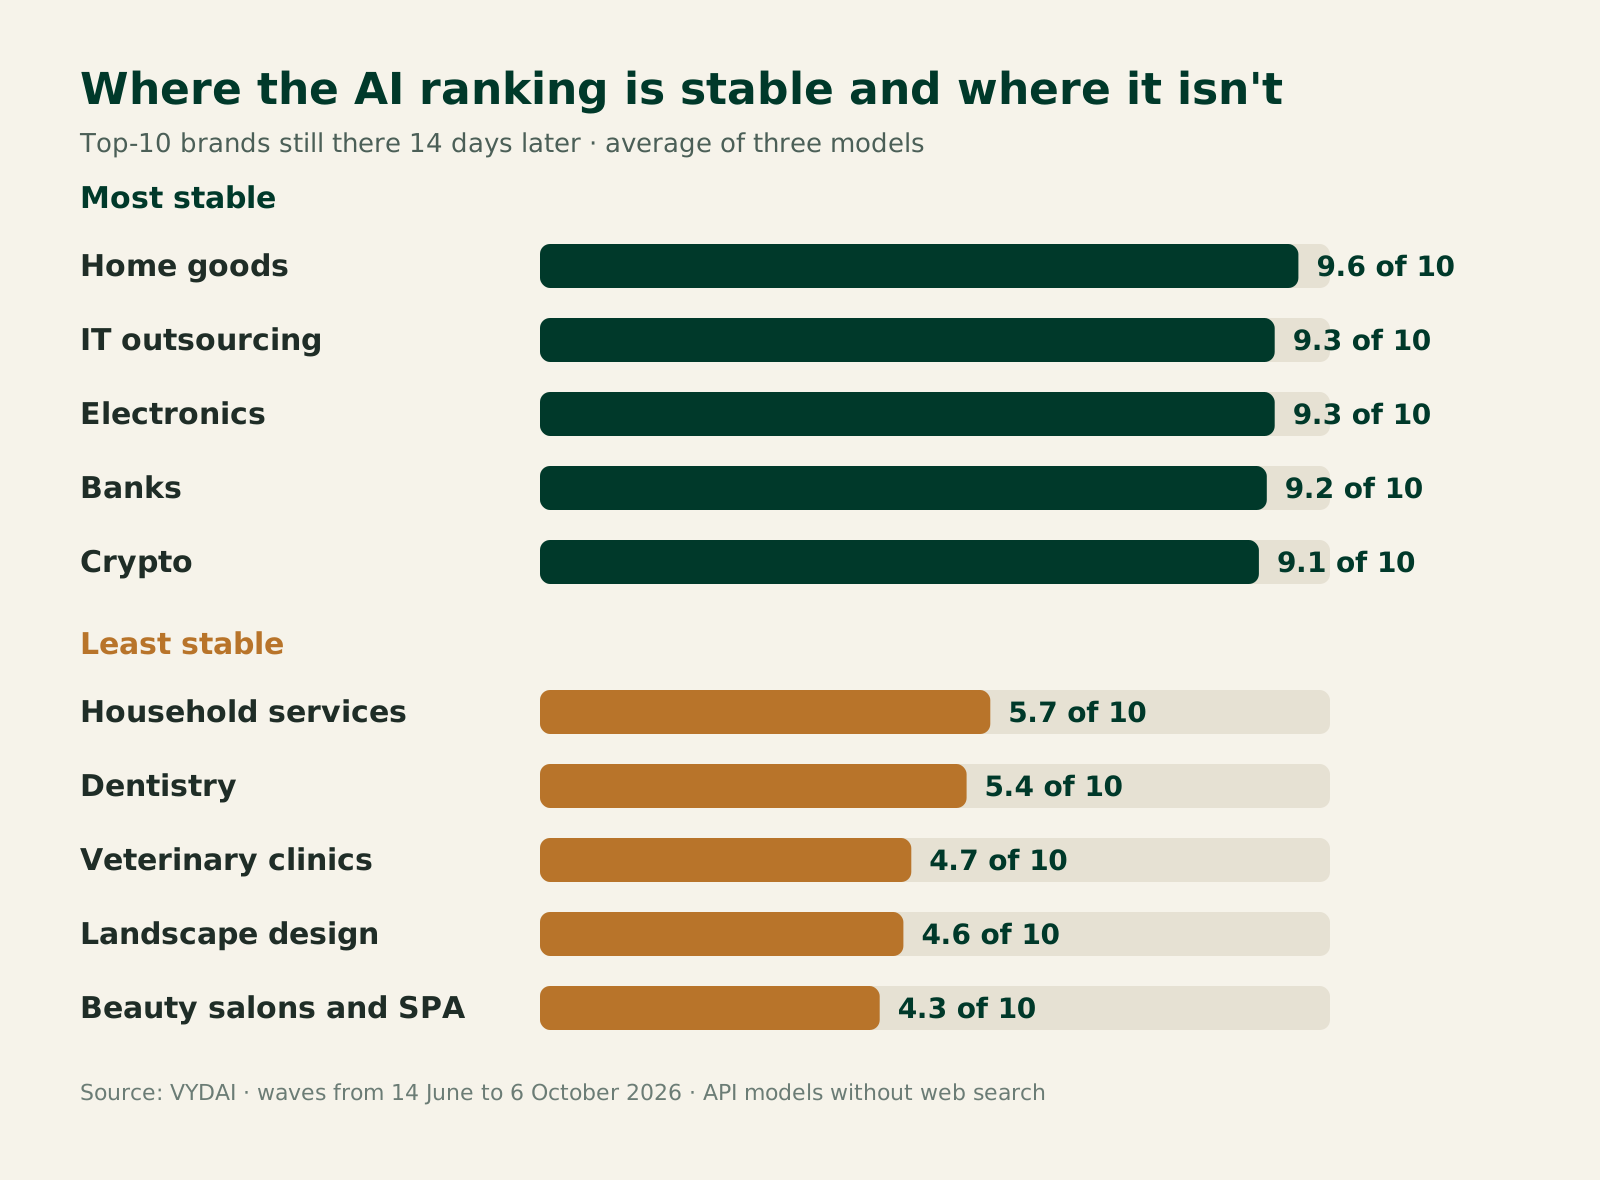
The same retention threshold therefore should not be applied mechanically to every niche. In a category where consumers choose among many local providers, a changing list may reflect the shape of the market as well as model variation. Looking at the exact prompt and geography helps explain the pattern.
Why AI gives different answers to the same prompt
Why does ChatGPT give different answers?
Even when a person types exactly the same thing, a consumer chat interface may carry conversation history, saved memory, search results, routing, or a model version that changed since the previous visit. The model generates text token by token, and several continuations can be plausible. Our panel measures API model calls without web search, so it does not measure all behavior of the consumer apps.
In hosted systems, computation can also affect the result. The Thinking Machines Lab explanation of nondeterminism in LLM inference describes how batch composition and non-invariant computation kernels can produce variation for the same input. This is a technical mechanism, not evidence that it changed any particular brand list in our study.
Does temperature 0 make answers deterministic?
No, it is not a universal guarantee. Anthropic's Messages API documentation says results will not be fully deterministic even at temperature 0, and lists 1.0 as the default. Our Claude calls used the default temperature of 1.0. OpenAI says Chat Completions are non-deterministic by default and that using the same seed and parameters gives mostly deterministic outputs, though backend configuration changes tracked by system_fingerprint can still change results. The Google Gemini documentation explains that temperature, topK, and topP control token selection and, for earlier Gemini 3 models such as 3.1 Flash-Lite, advises keeping the defaults to avoid degraded reasoning. We did not set temperature in this study.
A study by Ouyang and colleagues on code generation found that temperature 0 reduced but did not eliminate nondeterminism. Their paper on nondeterministic ChatGPT code generation examines a different task, but it helps explain why a fixed setting alone does not guarantee identical output.
“I asked ChatGPT and we are not there” is not a measurement
One answer can show that a model mentioned or omitted a brand under one set of conditions. It cannot establish that the brand is absent from the model's recommendations in general. Our one-call resampling exercise recovered only 4.1 of the reference top 10 for GPT, 3.8 for Gemini, and 2.0 for Claude on average. The chance that a reference leader appeared in the first three positions of that single answer was 25%, 25%, and 17% respectively.
| Brand's category rank | GPT: share of answers mentioning the brand | Gemini | Claude |
|---|---|---|---|
| 1 | 74.4% | 69.1% | 40.7% |
| 3 | 52.0% | 44.7% | 26.7% |
| 5 | 34.2% | 33.1% | 14.9% |
| 10 | 16.0% | 16.7% | 8.0% |
A brand ranked tenth in GPT's category list is absent from about 84% of single GPT answers.
Absence from one answer means only that the name did not appear in that answer. It does not prove that the model never mentions it. For other reasons a brand may be missing and how to inspect the context, see our guide to why your brand does not appear in ChatGPT, Gemini, or Claude.
That distinction matters when a team is deciding whether to change content, positioning, or a product page. First ask if the observation repeats across different prompts and later measurements. Then inspect the answer itself and the source context, rather than treating a screenshot as a market verdict.
What sample size is enough to measure AI visibility?
To estimate a category top 10, our resampling result gives a first reference point: at least 20 different prompts per model for an initial picture and 50 for a decision that needs broader coverage. These are not a universal standard or guarantee. They show how many brands from a reference top 10 a random sample recovered in this study.
For each category and model, we defined the reference top 10 from five later waves, then drew random samples from earlier waves. The measure is simple: how many of the 10 reference brands appeared in the small sample's top 10. We repeated each format 12 times with different random draws. This measures list overlap, not the statistical margin of error for a mention share.
| Different prompts × repeat waves | Calls | GPT: found of 10 | Gemini: found of 10 | Claude: found of 10 |
|---|---|---|---|---|
| 1 × 1 | 1 | 4.1 | 3.8 | 2.0 |
| 1 × 4 | 4 | 5.0 | 4.5 | 2.9 |
| 5 × 1 | 5 | 5.9 | 5.7 | 3.5 |
| 5 × 4 | 20 | 7.1 | 6.9 | 5.7 |
| 10 × 1 | 10 | 7.0 | 6.9 | 4.8 |
| 10 × 2 | 20 | 7.5 | 7.4 | 5.9 |
| 10 × 4 | 40 | 7.9 | 7.7 | 6.6 |
| 20 × 1 | 20 | 7.6 | 7.7 | 6.0 |
| 20 × 2 | 40 | 8.0 | 8.1 | 6.8 |
| 20 × 4 | 80 | 8.3 | 8.4 | 7.4 |
| 50 × 1 | 50 | 8.4 | 8.4 | 7.1 |
| 50 × 2 | 100 | 8.7 | 8.7 | 7.7 |
| 50 × 4 | 200 | 8.9 | 8.8 | 8.1 |
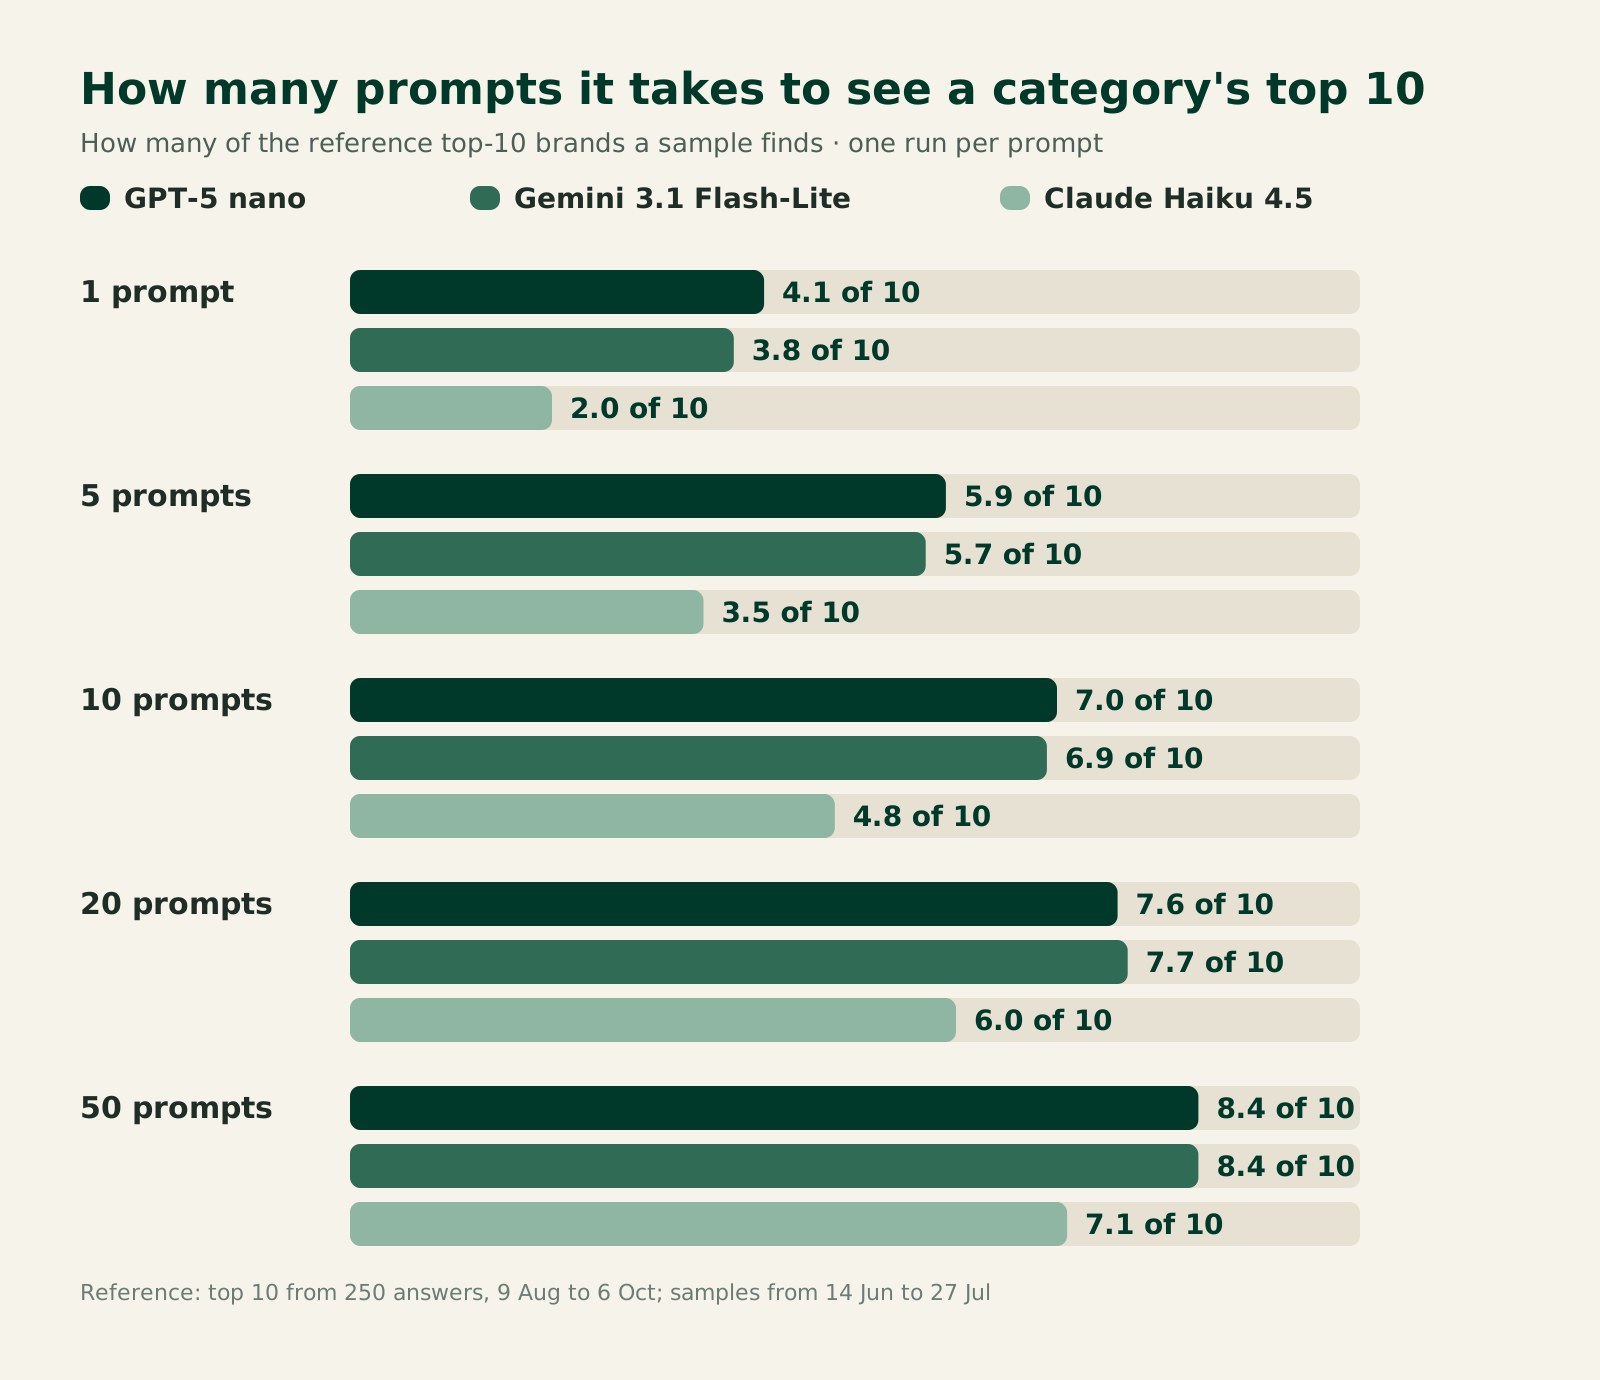
With the same number of calls, adding different prompts produced a better result than repeating fewer prompts. For example, 20 separate prompts recovered 7.6 GPT brands and 6.0 Claude brands. The same 20 calls as five prompts repeated four times recovered 7.1 and 5.7. Repeats still matter when the question is variability within one scenario, but a first category overview benefits from wider prompt coverage.
Fifty different prompts recovered an average of 8.4 of 10 brands for GPT and Gemini, and 7.1 for Claude. The lower decile was weaker than the average: for the 50 by 1 sample it was 7 for GPT, 7 for Gemini, and 5 for Claude. Fifty prompts give a stronger view, but do not guarantee that every important brand will be found. In this test Claude needed more data to approach the GPT or Gemini result.
Building a prompt pool is a separate task. If you need to choose topics and wording, see our guide to how to choose prompts for AI visibility monitoring. The key point here is that even a well-built pool needs enough different prompts to estimate a category picture.
Margin of error for brand mention rate
If the metric is the share of responses that mention one brand, it can be treated as an estimate of a proportion. In its calculation of the number of observations needed for one prompt and one model, commercial AI visibility provider Gumshoe gives about 97 repeats for a margin of error of ±10 percentage points and 385 for ±5 points at an approximate 95% interval. NIST/SEMATECH's reference on proportion intervals describes the formula and alternatives such as Wilson intervals.
Those calculations apply to one brand's mention share in repeated answers to the same prompt. They do not transfer automatically to a top 10, a diverse prompt pool, or list similarity. Those questions have different units of observation, and brand frequency depends on the prompt topic. That is why we separately tested sample size against a reference top 10.
How to distinguish noise from a real change
Check a shift in a report before changing strategy.
| What changed | How to read the signal |
|---|---|
| One brand disappeared from one answer | This does not prove a loss of category visibility. Check other prompts with the same intent |
| One or two GPT or Gemini brands changed in the top 10 between waves | This fits average churn: about 8 of 10 remained in the next wave |
| Up to three Claude brands changed in the top 10 between waves | This is also normal churn: average retention was 6.7 of 10. Compare several later waves |
| Half the top 10 changed in a fragmented service niche (beauty salons, vet clinics) | Average retention there was only 4.3–4.7 of 10. Look at how many prompts mention the brand, not at positions six through ten |
| The first-place brand changed | The same leader returned in the next wave in 64% of GPT cases, 78% of Gemini cases, and 57% of Claude cases. Check the next wave before drawing a conclusion |
| Movement appears across different prompts and several measurements in a row | This is stronger evidence for investigating the cause than a single screenshot |
| The prompt pool, model, search mode, or counting rule changed | Restore comparable conditions first or label the break in method |
For every measurement, record the prompt text, model, date, search mode, response success, and brand aggregation rule. Compare aggregate metrics, then inspect the answers that drove a change. This helps separate a new tendency from sampling noise. For a wider view of metrics, see our article on AI visibility versus SEO and which metrics matter now.
If the question is whether the market changed rather than whether two waves differ, repeat the same pool at consistent intervals. Waves in this panel ran about every 14 days. That was our study interval, not a universal schedule for every business. The more important the decision, the more useful it is to have enough independent observations and several comparable measurements.
Study limitations
The results describe 65,544 successful API responses from GPT-5 nano, Gemini 3.1 Flash-Lite, and Claude Haiku 4.5 to an editorially assembled pool of Ukrainian prompts. Web search was off in every call. This is not a sample of all human queries and not an observation of the ChatGPT, Gemini, or Claude consumer apps. Consumer interfaces may add history, memory, search, routing, or a model that has since been updated.
We calculated the main similarity measures for waves 3 to 11. Gemini moved from preview to general availability after the first wave, and its version did not change afterward. We did not set temperature and used provider defaults. A separate model extracted brands, and the alias dictionary could not resolve every ambiguity. Some long-tail mentions are difficult to verify; a one-off mention is not automatically an error or fabrication.
Some categories had fewer successful GPT calls, especially services. Ties at tenth place were resolved with a fixed rule, and close positions may appear in a different order. The reference top 10 for resampling was built from a limited period, so it is a benchmark for this experiment, not a definitive list of the best brands in a niche.
Finally, a brand mention does not mean a recommendation, factual accuracy, or product quality. It only means the name appeared in the response under specific conditions. For a marketing decision, also inspect the answer's content, context, and sources.
Frequently asked questions
Why does ChatGPT give different answers?
A model generates new text, and in a chat product the result may also depend on conversation history, memory, search, routing, and the available model version. Our API panel ran without web search, yet the sets of brands still changed.
Does ChatGPT give the same answer every time?
Not necessarily. A new answer to the same prompt repeated an average of 53% of the previous answer's brands for GPT, 49% for Gemini, and 20.2% for Claude. A complete list was identical in fewer than 2 out of 100 adjacent comparisons.
Are AI answers consistent?
It depends on the level of measurement. Individual answer lists changed substantially, but a category top 10 built from 50 prompts retained about 8 of 10 brands for GPT and Gemini between nearby waves, and 6.7 for Claude.
Do AI recommendations change over time?
Individual answers change all the time, but the category top 10 barely drifts. Of the late-May top 10, 7.8 brands were still there in early October for GPT, 8.2 for Gemini, and 6.1 for Claude. That is almost the same as after two weeks: 8.2, 8.3, and 6.7.
Does temperature 0 make answers deterministic?
No, it does not guarantee that every result will match. Anthropic says even temperature 0 is not fully deterministic. OpenAI calls outputs with the same seed and parameters only mostly deterministic, because a backend change can still alter them.
What sample size is enough to measure AI visibility?
In our resampling, 20 different prompts gave an initial reference, and 50 recovered more of the GPT and Gemini top 10. Claude's recovery was weaker. These are results for this design, not a universal guarantee.
What is the margin of error for brand mention rate?
It describes uncertainty in the estimate of how often a brand appears in answers. A formula for one model and one prompt does not measure the accuracy of a category ranking. Use a separate sample check for a top 10 and compare several waves.
How we do this at VYDAI
The public category ratings show which brands appear in answers from OpenAI, Anthropic, and Google models and how their visibility changes between measurements. The ratings use a pool of 50 prompts per category and update about every two weeks.
In VYDAI, you add your own prompt pool. VYDAI regularly runs those prompts across several AI systems and shows brand mentions, share of voice, competitors alongside your brand, and changes between runs. For a small manual check, you can also start with 20 different prompts and keep the conditions the same from one measurement to the next. View the VYDAI demo or create an account to see how it works.